The Day I Stopped Treating LLDB Like a Panic Button
For most developers, LLDB appears only when something goes wrong.
The app crashes.
Xcode pauses execution.
You glance at the console, maybe type po something, and move on.
That was my relationship with LLDB for a long time. I never really learned it. I just used it whenever Xcode forced me to.
Recently I decided to explore it from the terminal instead of through the IDE. Not to debug a bug, but simply to understand how it works.
What I discovered was interesting. LLDB is less about fixing crashes and more about interacting with running programs.
You can attach to them, launch them, observe them, and experiment with how they start.
Once you see that, LLDB feels less like an emergency tool and more like a control panel for processes.
So I started with a tiny program.
A Small Program That Just Stays Alive
To explore LLDB properly, we need a program that keeps running long enough for us to attach to it.
import Foundation

print("Yay Running!")
CFRunLoopRun()
The important line here is CFRunLoopRun(). Without it the program would exit immediately.
Compile it using Swift:
swiftc debugee.swiftNow we have a simple executable that prints a message and then stays alive.
Perfect for experimenting.
Attaching to a Running Process
Let’s start the program in the background.
./debugee &Now it is running somewhere in the system.
Instead of launching the program from LLDB, we can attach to the already running process.
lldb -n debugeeLLDB searches for a process with that name and connects to it.
This moment is interesting the first time you see it happen. You did not start the program with LLDB, but you were still able to connect to it and observe it.
It feels like walking into a room where a program is already running and quietly taking a seat to watch what it is doing.
Waiting for a Process That Has Not Started Yet
Sometimes the process you want to attach to does not exist yet.
Instead of repeatedly trying to attach, LLDB can simply wait for it.
lldb -n debugee -wThe -w option tells LLDB to stay ready and attach as soon as the process launches.
This is surprisingly useful when exploring tools or services that start later or are triggered by another program.
Instead of chasing the process, LLDB patiently waits for it to appear.
Launching a Program From LLDB
Attaching is only one way to start interacting with a process.
LLDB can also launch the program itself.
First specify the executable:
lldb -f ./debugeeOnce inside LLDB, start it with:
(lldb) process launch
Now LLDB is responsible for launching the program. This gives you control over how the program starts and what environment it runs in.
Even with a simple program like this, it is a nice way to see how LLDB manages processes.
Exploring Another Target
LLDB is not limited to your own programs. You can use it to launch and observe other executables as well.
For example, you can set the target to the ls command.
lldb -f /bin/lsNow launch it from within LLDB.
(lldb) process launch /Applications
This runs the ls command on the Applications directory, but this time the program was started from inside LLDB.
Running simple commands this way is a good way to get familiar with how LLDB interacts with processes.
A Small Note About System Executables
If you try targeting a system binary like /bin/ls, you might run into a small restriction on macOS.
Since you are not the owner of that executable, the system may prevent LLDB from attaching to it unless System Integrity Protection (SIP) is disabled.
Disabling SIP just to experiment with LLDB is usually not worth it.
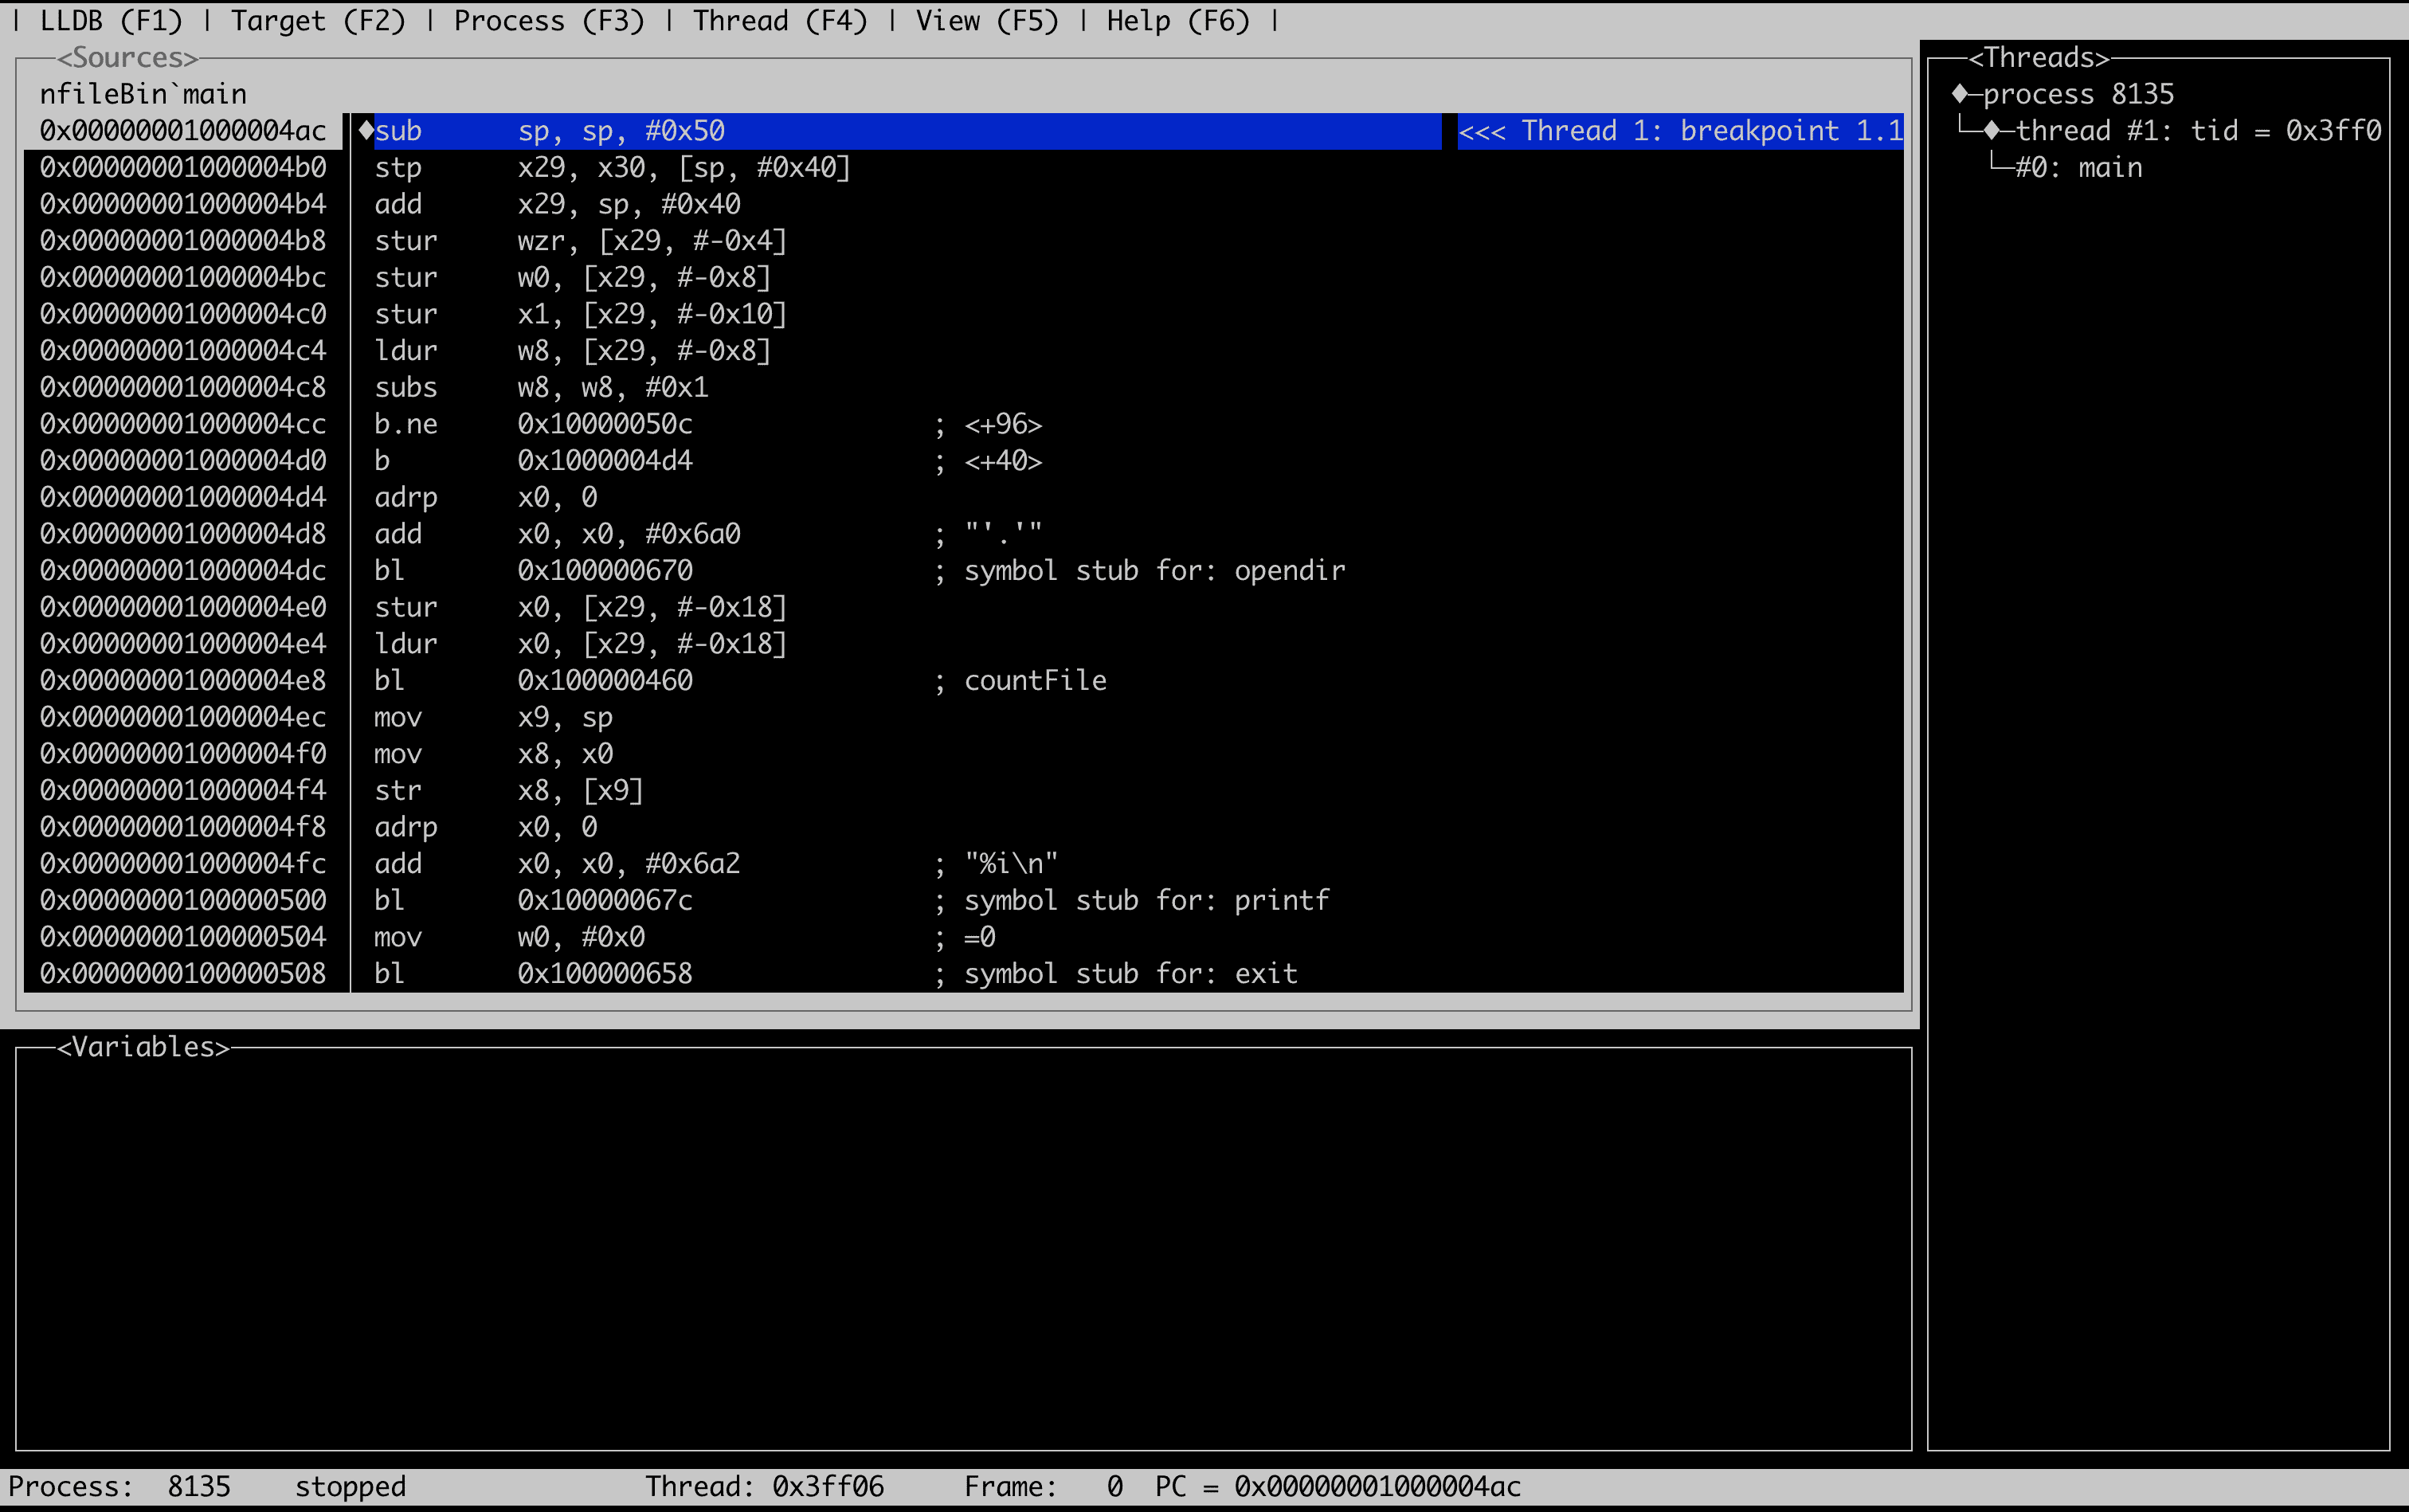
A simpler alternative is to use a small utility like nfile. It behaves similarly to tools like ls, but since it’s your own binary, LLDB can interact with it without any system restrictions.
Looking at Environment Variables
Programs often behave differently depending on environment variables.
LLDB allows you to see and modify them when launching a program.
To display the environment variables that will be used:
(lldb) env
One small detail here is that LLDB only shows them after the target has been run at least once.
You can also override variables when launching the program.
(lldb) process launch -E LSCOLORS=Af -E CLICOLOR=1 /usr/share
This launches ls with custom color settings.
Even though this example is simple, it shows how LLDB can control the environment a program runs in.
Controlling Program Input and Output
LLDB can also control where a program reads input from and where it sends its output.
For example, the output of a command can be written to a file.
(lldb) process launch -o /tmp/ls_output.txt /usr/share
Instead of printing to the terminal, the output goes into a file.
Input can be redirected as well.
First change the target program.
(lldb) target delete
Then create a new target for the wc command.
(lldb) target create /usr/bin/wc
Now launch it with an input file.
(lldb) process launch -i /tmp/wc_input.txt
This behaves the same as running this in the shell:
wc < /tmp/wc_input.txtThe difference is that it is now happening inside LLDB.
Getting Comfortable With LLDB
At this stage we are not debugging anything yet.
There are no breakpoints, stack traces, or crash investigations.
The goal here is simply to get comfortable with how LLDB interacts with processes.
By the end of this small exploration you have already seen that LLDB can
- attach to running programs
- wait for programs that have not started yet
- launch executables directly
- control environment variables
- redirect input and output
All of this happens before touching any real debugging commands.
And that is what makes learning LLDB easier. Instead of jumping straight into complex debugging sessions, you start by simply observing how programs run and how LLDB connects to them.
Once that feels natural, the rest of LLDB starts to make much more sense.